|
Interactive Scheduling and Planning
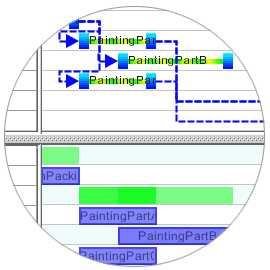
ILOG Views Gantt chart provides complete support for managing schedules. Charts can manage numerous activities, organized by resources following a time axis. The Gantt chart module benefits from all of ILOG Views' advanced features: a rich set of activity representations, powerful and extensible interactions and high-performance multiview display. An object-oriented architecture makes the module highly customizable, enabling it to meet any application need.
Multiple views of schedule data
Different operations demand individual scheduling interfaces for tasks such as viewing factory machines along with activities, or listing activities, dependency and time occurrence. Users often need to edit information, either with tables or by moving activity bars in a Gantt sheets. ILOG Views Gantt Chart satisfies all these demands.

With ILOG Views Gantt charts, users can create, edit and manage very large data sets:
- Resources and tasks, the basic scheduling inputs.
- Activities and subactivities, which have a start time, end time and resource capacities.
- Precedence constraints, showing task dependencies. These are defined by Gantt links that have a starting activity, ending activity and a delay.
Interactivity
ILOG Views Gantt Chart provides most common interaction modes, including:
- Editing
- Zoom, pan and scroll
- View-point information
- Create, move, resize and delete activities
- Create, modify and delete dependencies
These modes can be combined and connected to a range of mouse events. Extensibility C++ object model provides an extension protocol for easy Gantt Chart customization.
|