|
|
Design interfaces that help users interact with applications. Images are easier to understand than form-oriented controls like menus, tables or text fields. Build realistic data views with the ILOG Views Component Suite.
|
|
| |
 |
|
Interactive 2D graphics. |
|
ILOG Views is the leading C++ library for building image-based GUIs. Powerful features simplify construction for a range of applications:
- Editors
- Web clients
- Supervision applications
- Map-based applications
Developers focus on application logic instead of coding. Applications can be deployed on Windows, Unix or Linux systems.
High-performance views
High-performance graphic objects
Robust, versatile graphic objects:
- Display thousands of vector and raster graphic objects
- Animate objects (display moving aircraft in air traffic control applications)
- Modify objects (display equipment status in real time)
- High-performance display and refresh (ideal tool for map displays)
 |
| |
|
|
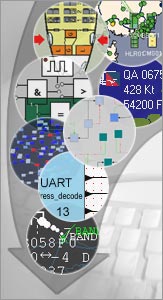
A custom magnifying interactor on top
of 2D graphic object.
Click to enlarge (opens a new window). |
|
Layers
Place graphic objects on different layers:
- Select visible layers
- Control display order
- Manage amount of information displayed at each zoom level
- Add user-friendly functions (allow users to customize displays)
Multiple individual views
Display several views without data duplication:
- Create overviews and powerful navigation functions, like geonavigators
- Visualize several parts of a large structure
- Specify layer visibility for each view
Decluttering with layers
Layers and layer visibility filters provide a powerful framework for displaying data by zoom level:
- Create one layer for each level of detail
- Visibility filters automatically trigger layer visibility, depending on zoom level
- Performance for object animation, interaction or editing set by number of objects visible on screen
Scalability
Maintains performance for display, zoom, animation and interaction -- even with thousands of graphic objects in memory. Spatial indexing optimizes spatial queries, improving real-time response and saving CPU resources.
Double buffering
Features double buffering that prevents image flickering in animated displays. Screen are not updated until the entire area is ready. Double-buffering triggers automatically.

Effective interactions
Object editing
Simple API for changing object properties like color, line style or label font and size. Includes out-of-the box interactors:
- Select, move or resize objects
- Edit control points of polygons or splines
- Insert new graphic objects by drag-and-drop
Scroll, pan and zoom
Supports navigation operations such as panning and zooming. A variety of interactors for zooming, scrolling and panning are available.
 |
| |
|
|
A schematic editor created with
ILOG Views Studio.
Click to enlarge (opens a new window). |
|
Defined interactions
Object interactors can be assigned to graphic objects for specific user interactions. Users can also implement custom interactions like context-dependant menus, alarm acknowledgment or custom editing.
Customer-oriented displays
Predefined graphic objects
Vast variety of predefined graphic objects, including lines, arrow lines, rectangles, shaded rectangles, polygons, polygons with holes, splines, ellipses, arcs, labels, icons and zoomable icons:
- All objects editable and clickable
- Customize foreground and background colors, line styles, thickness and background colors or patterns for vector objects
- Aggregate objects into groups to form more complex objects
- Write custom classes of graphic objects for creating specific objects, such as objects that will display more information when zoomed
Many bitmap formats
Read images from JPEG, PNG, BMP, WBMP and PPM formats. Users can transform bitmaps into zoomable objects or fixed-size icons. Operations available include mixing bitmaps with various transparent levels, rotating bitmaps or reducing the number of colors.
Bitmap generation
Ability to dump views to a bitmap in JPEG, PNG, BMP, WBMP and PPM formats. This feature enables development of Web or WAP servers generating structured 2D graphics.
Fast, easy animation
Supports fast object animation with an easy mechanism for invalidating areas and updating relevant views. Ideal for displaying moving objects, blinking objects or objects that must update a status in real time.
Localization support
Multilingual applications are easy to create. Multiple message and icon translations use the appropriate language. Multibyte encoding displays Japanese or Chinese fonts.
Printing
Views can be printed to Postscript or Windows printers. Draw orders are redirected to the requested printer, which is seen as a drawing port, exactly like a window.
Advanced functions
User scripting
Easy scripting facilities:
- Allows on-site customization of applications without recompilation
- Provides an implementation of JavaScript
- Graphic objects, positions, properties and functions can be modified or called
Graph editing
Extensive graphing capabilities:
- Native support for graph displays
- Display and edit network structures
- Automatically maintains consistency between links and nodes
Many types of links
Provides many types of links: direct links, links with arrows, polyline links, spline links, arc links, orthogonal links. Link properties -- like color, line style or thickness -- can be modified to reflect the semantics behind the link. For custom links, link handles can turn any graphic object into a link.
Custom link connections
Links can be connected precisely to graphic objects:
- Connect to an angle, the center of an icon or distribute along a border
- Out-of-the-box interactors let users define connection points
- API lets developers define possibilities
 |
| |
|
|
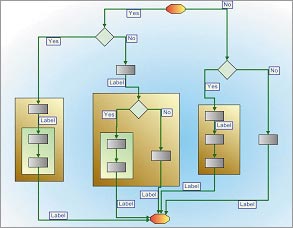
ILOG Views Graph Layout process flow representation. |
|
Links on links
Typical graph editors only connect links to nodes, but some diagrams -- like workflows -- need display links connected to main stream links. ILOG Views 2D Graphics seamlessly handles these special connections. The connection point to a link can easily be defined. If the user moves an element, the links automatically follow.
High performance for graph display
Graph displays are highly scalable:
- Display hundreds of nodes and links
- All standard 2D graphics features available for graph display and edition
- Layers supported
- Graph elements (nodes and links) can be placed in different layers
Business graphic objects
ILOG Views 2D Graphics Professional studio can be used to visually create code-free animated objects, called Business Graphic Objects (BGOs):
- Can be used in supervision applications to represent equipment status
- Enables developers to create hundreds of symbols
- Behavior can be defined with JavaScript embedded in ILOG Views 2D Graphics
 |
| |
|
|
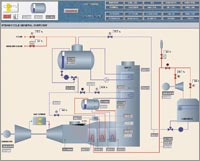
ILOG Business Graphic Objects in
a supervision application.
Click to enlarge (opens a new window). |
|
Web deployment
Applications can be deployed to Web servers and viewed using a browser via thin clients:
- Export interactive images
- Zoom, scroll and select graphic objects
- Compatible with multisession or sessionless applications
- Connects with real-time data sources
- Supports Explorer 4, 5.0 and 5.5; Netscape Communicator 4.5, 4.7 and 6.0
Easy integration
Comprehensive documentation
Contains comprehensive API documentation, a user's manual and tutorials. In addition, the product contains a set of code samples for different features. ILOG also offers professional services to help you get the most out of our products.
Integration with other ILOG Views Component Suite products
Integrates perfectly with other ILOG Views Component Suite products:
Platform integration and cross-platform deployment
Integrates seamlessly with Windows, Linux or Unix applications.
|