|
C++ Class Library for Fast, Easy, Interactive Charts
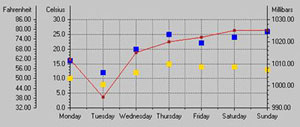
ILOG Views Charts is a C++ class library that extends ILOG Views to provide easy, fast and interactive chart components. It fully supports a wide range of formats, including bars, lines, areas, pies, bubbles and hi-lows.
ILOG Views Charts runs with Windows, UNIX and Linux. Easy to learn and apply, it can quickly be integrated into existing applications.
Vast variety of charts formats
ILOG Views Charts supports many chart formats:
- Bars
- Lines, points and areas
- Stairs
- Hi-lows
- Stacked charts
- Bubbles
- Pies
- Linear or logarithmic scales
- Charts with multiple axes
All these formats can be displayed using Cartesian or polar representation.
Rapid application development
 ILOG Views Charts includes ILOG Studio, a visual GUI builder that allows developers to set the layout of chart components (such as scales, grids, legends or displayers).
ILOG Views Charts uses Model View Controller architecture to separate data model, rendering and interactions, allowing rapid connection and customization of different chart elements.
Real-time data support
 ILOG Views Charts provides native support for dynamic data. Optimized to offer the best level of performance for dynamic updating, it includes the following modes: ILOG Views Charts provides native support for dynamic data. Optimized to offer the best level of performance for dynamic updating, it includes the following modes:
- Automatic redraw upon data update
- Shift scrolling mode
- Cyclic mode
Data can also be read from XML files.
Interactivity
 ILOG Views Charts provides most common interaction modes, including:
- Data edition
- Zoom, pan and scroll
- View-point information
- Tracking value along a curve
These modes can be combined and connected to a range of mouse events.
Extensibility
 C++ object model provides an extension protocol for easy chart customization, including:
- Rendering style
- Interaction modes
- Scales
- Connection to the data source
- Legend display
|